
Understanding the Concept of Data Science
1. Introduction to Data Science
At its core, Data Science is a specialized field of study that combines domain expertise, programming skills, and knowledge of mathematics and statistics to extract meaningful insights from data.
Think of it as detective work, but instead of looking for physical clues, a data scientist searches through massive amounts of data (numbers, text, images, videos) to find hidden patterns, trends, and answers.
What is Data?
Data is the raw material for Data Science. It generally falls into two types/categories:
- Structured Data: Highly organized data that fits neatly into tables, rows, and columns (like an Excel spreadsheet or a school attendance register).
- Unstructured Data: Unorganized data that doesn’t have a predefined format (like emails, YouTube videos, social media posts, or audio recordings).
The Data Science Process (The Data Cycle)
To solve a problem, a data scientist typically follows these steps:
- Data Collection: Gathering raw data from various sources (surveys, sensors, web scraping).
- Data Cleaning: Removing errors, duplicates, or missing values to make the data accurate.
- Data Analysis: Using statistical methods to explore the data and find patterns.
- Interpretation & Visualization: Creating charts, graphs, and dashboards to present the findings in an easy-to-understand way.
Why is it important in AI? > Artificial Intelligence models cannot “learn” without data. Data Science provides the high-quality, organized data that feeds Machine Learning and AI algorithms, making them smart enough to make decisions.
2. Applications of Data Science
Data Science is a multi-disciplinary field that leverages various techniques, algorithms and tools to extract valuable insights and knowledge from data. It has a wide range of applications across different domains:
i. Healthcare and Medicine
Data science is saving lives by enabling doctors to make better, faster decisions by analyzing patient history and medical data, AI models can predict the likelihood of diseases (like diabetes or heart conditions) before symptoms even appear. Medical imaging algorithms can analyze X-rays, MRIs, and CT scans to detect tumors or fractures with incredible accuracy.
ii. E-Commerce and Personalization
Recommendation Systems are the best examples of Data science algorithms. They analyze our past browsing history, search queries, and purchase habits to recommend products and content tailored specifically to our taste. For example Amazon knows what you want to buy, or Netflix knows exactly what show you want to watch next.
iii. Banking and Finance
The financial sector relies heavily on data science to manage risks and secure transactions.
- Fraud Detection: Banks use data science to track spending patterns in real-time. If a transaction occurs that doesn’t match your usual behavior (e.g., a massive purchase made in another country), the system flags it instantly as potential fraud.
- Credit Scoring: Algorithms analyze an individual’s financial data to determine how risky it is to give them a loan.
iv. Transport and Logistics
Data science makes traveling and shipping goods much more efficient.
- Route Optimization: Companies like Google Maps, Uber, or FedEx use data science to analyze live traffic, weather conditions, and road closures to find the fastest possible routes.
- Self-Driving Cars: Autonomous vehicles continuously collect data from cameras, radar, and sensors to understand their surroundings and drive safely without a human operator.
v. Search Engines
Every time you look something up online, data science is at work behind the scenes.
- Optimized Search Results: Search engines like Google use data science algorithms to analyze your query and scour billions of web pages in a fraction of a second, delivering the most relevant results to your screen.
vi. Social Media and Marketing
Social media platforms use data to keep users engaged and help businesses target the right audience.
- Targeted Advertising: Instead of showing the same ad to everyone, data science allows companies to display ads based on a user’s specific age, location, and interests.
- Sentiment Analysis: Brands analyze comments, reviews, and tweets to understand whether the public sentiment toward their new product is positive, negative, or neutral.
Some other applications of Data Science may be like Chatbots, Agriculture industry, Gaming, Smart assistant etc.
==============================================
3. No-Code AI
No-Code AI is a category of software tools that allows anyone to build, train, and deploy AI models without writing a single line of computer code.
Instead of typing out algorithms, users interact with a visual interface. You can think of it like building with digital LEGO bricks—you use features like drag-and-drop, visual menus, and simple forms to connect data to an AI model.
4. Low-Code AI
Low-Code AI is a method of building and deploying Artificial Intelligence applications using visual tools—like drag-and-drop interfaces and pre-built templates—while still allowing users to write a small amount of custom computer code when needed.
It acts as a middle ground between traditional programming (where you write everything from scratch) and No-Code AI (where you cannot write any code at all).
Orange Data Mining Tool
Orange is an open-source, component-based software package used for data visualization, machine learning, data mining, and data analysis.
It is one of the most popular No-Code / Low-Code AI tools used by students, teachers, and researchers globally because it eliminates the need to write complex Python script files from scratch. Instead, it relies on a visual programming interface where you can build data science projects visually.
Activity to be done in class: Orange Data Mining using Palmer Penguins , MS Excel for Statistical Analysis
5. Big Data
Big data refers to massive, complex datasets that traditional data processing tools can’t handle. It is defined by its scale (volume), speed of generation (velocity), and diversity of formats (variety), requiring advanced analytics and specialized infrastructure to extract useful insights.
Volume represents the massive size and physical scale of collected data, which is too large to fit on regular hard drives and is typically measured in massive storage units like terabytes, petabytes or zettabytes. Tools like Hadoop and Spark are used to handle and process it.
Veracity refers to the quality, consistency, and overall trustworthiness of the data, which measures how accurate or messy the collected information is, as real-world data often contains errors, duplicates, and fake or missing information.
Some important tools to analyse Data using Python programming:
- NumPy (Used to do mathematical operations)
- N-D Arrays (The core data structure in NumPy)
- Pandas (For data manipulation and analysis)
- Matplotlib (Used to draw different types of graphs)
- CSV Files (Comma – Separated Values- Used for structured data representation)
6. KNN(K-Nearest Neighbour)
KNN stands for K-Nearest Neighbours. It is one of the simplest and most intuitive Machine Learning algorithms used for both Classification (predicting a category/label) and Regression (predicting a continuous value or number).
The core philosophy behind KNN is simple. It assumes that similar data points will naturally exist close to each other in a graph or data space.
The “K” in KNN refers to the number of nearest neighbours that will be used to make the prediction.
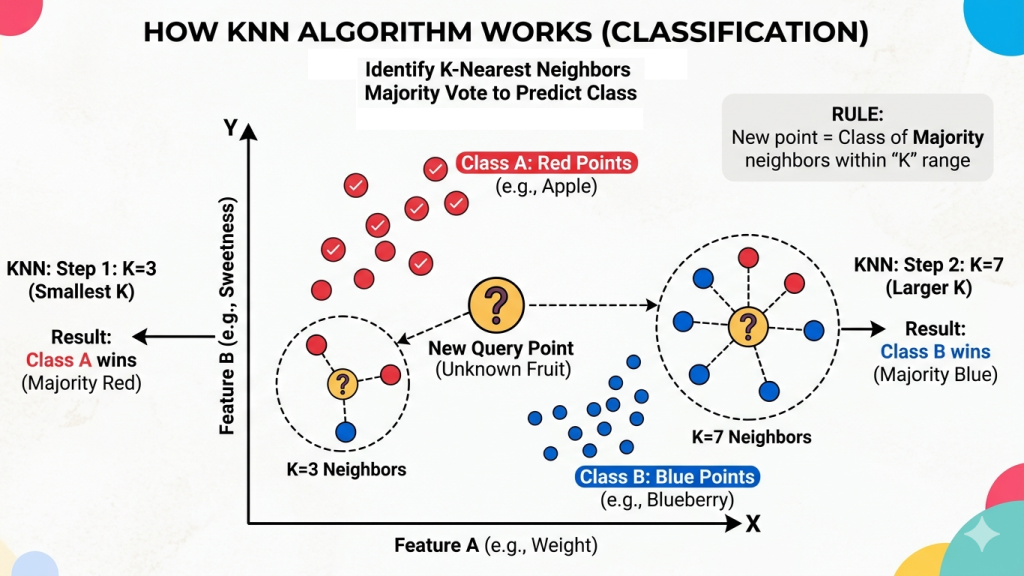
- The Data points in the above image are plotted on a graph based on two features (e.g., Weight vs. Sweetness). Existing data belongs to two known categories: Class A (Red) and Class B (Blue).
- The Problem: A new, unknown data point (Yellow
?) is introduced, and the AI must classify it based on its closest neighbors. - Case 1 (K = 3): The AI checks the 3 closest neighbors. The circle contains 2 Red and 1 Blue. By majority vote, Class A (Red) wins.
- Case 2 (K = 7): The AI expands its search to the 7 closest neighbors. The larger circle contains 5 Blue and 2 Red. By majority vote, Class B (Blue) wins.